
The January 1 implementation of the new OSFI B-20 regulations requires that uninsured mortgage borrowers be stress-tested at a mortgage rate 200 basis points above the contract rate at federally regulated financial institutions. It is no surprise that home sales rose in advance of the new ruling in November and December. Even so, activity remains below peak levels earlier in 2017 and prices continued to fall in the Greater Toronto Area (GTA) and in Oakville-Milton, Ontario for the eighth consecutive month. Prices also fell last month in Calgary, Regina, and Saskatoon–cities that have suffered the effects of the plunge in oil and other commodity prices beginning in mid-2014.
Mortgage Rates Are Rising
Ever since the release of exceptionally strong yearend employment data for Canada on January 5th, there has been a widespread expectation that the Bank of Canada would hike the target overnight interest rate by 25 basis points this Wednesday, taking it to 1.25 percent. Indeed, market rates have already risen in response to this expectation. The Royal Bank was the first to hike its posted 5-year fixed mortgage rate to 5.14 percent last Thursday, up from 4.99 percent. Other banks quickly followed suit.
It used to be that a hike in the posted rate was of little consequence because borrowers’ contract rates were typically much lower. However, government regulations put in place in October 2016 now force borrowers with less than a 20 percent down payment to qualify at the posted rate. And the new OSFI regulations effective this year now require even those with more than a 20 percent down payment to qualify at a rate 200 basis points above the contract mortgage rate at federally regulated financial institutions.
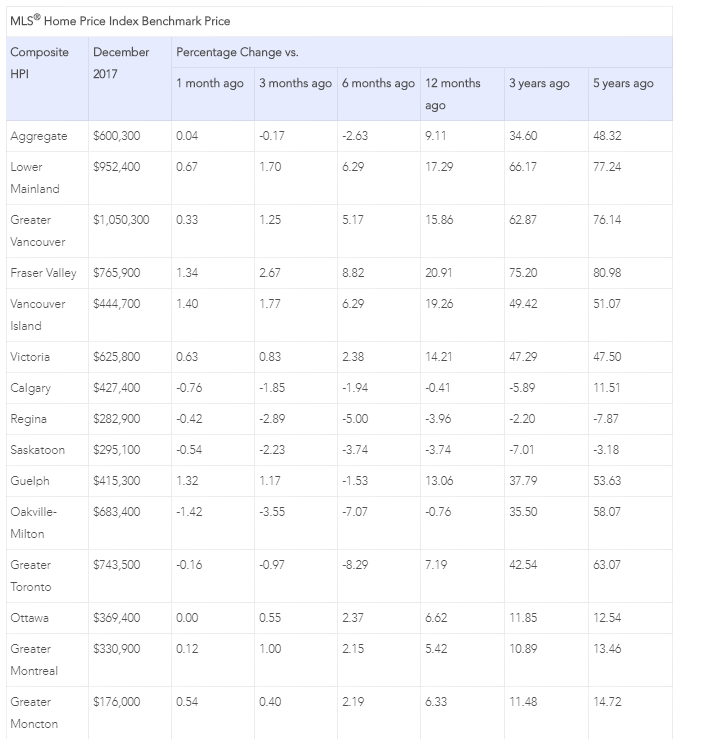
It has been four years since the posted five-year fixed mortgage rate exceeded 5 percent. And it has been nearly a decade since homebuyers had to qualify at contract mortgage rates that high–when government stress-testing rules didn’t exist. A decade ago, house prices in Canada’s major cities were substantially lower. Indeed, as the table below shows, house prices in the Greater Vancouver Region, Fraser Valley and the Lower Mainland of British Columbia have increased by nearly 80 percent in just the past five years. In the GTA, home prices are up over 60 percent over the same period. These price gains dwarf income increases by an enormous margin. So clearly, housing affordability has plummeted and the combination of tightening regulations and rising interest rates will no doubt dampen housing activity.
This is one factor that could weaken the case for a Bank of Canada rate hike this week. Another is the potential failure of NAFTA negotiations–a threat to three-quarters of Canada’s exports. Additionally, inflation remains low and wage gains–though rising–are still quite moderate.
Hence the case for a Bank of Canada rate hike this week is not incontestable.
U.S. market interest rates have risen significantly this year, and many bond traders are now forecasting the end of the secular bull market in bonds as the U.S. economy approaches full-employment and fiscal stimulus (the recent tax cuts) will boost the federal budget deficit.
December Home Sales Rise
The Canadian Real Estate Association (CREA) reported today that national home sales jumped 4.5% from November to December–their fifth consecutive monthly increase. Activity in December was up in close to 60% of all local markets, led by the GTA, Edmonton, Calgary, the Fraser Valley, Vancouver Island, Hamilton-Burlington and Winnipeg.
While activity remained below year-ago levels in the GTA, the decline there was more than offset by some sizeable y-o-y gains in the Lower Mainland of British Columbia, Vancouver Island, Calgary, Edmonton, Ottawa and Montreal.
New Listings Shot Up
Many sellers decided to list their properties ahead of the mortgage rule changes. The number of newly listed homes rose 3.3% in December. As in November, the national increase was overwhelmingly due to rising new supply in the GTA. New listings and sales have both trended higher since August. As a result, the national sales-to-new listings ratio has remained in the mid-to-high 50% range since then.
A national sales-to-new listings ratio of between 40% and 60% is consistent with a balanced national housing market, with readings below and above this range indicating buyers’ and sellers’ markets respectively. That said, the balanced range can vary among local markets.
Considering the degree and duration that the current market balance is above or below its long-term average is a more sophisticated way of gauging whether local housing market conditions favour buyers or sellers. Market balance measures that are within one standard deviation of the long-term average are generally consistent with balanced market conditions. Based on a comparison of the sales-to-new listings ratio with its long-term average, more than two-thirds of all local markets were in balanced-market territory in December 2017.
The number of months of inventory is another important measure of the balance between housing supply and demand. It represents how long it would take to liquidate current inventories at the current rate of sales activity.
There were 4.5 months of inventory on a national basis at the end of December 2017. The measure has been moving steadily lower in tandem with the monthly rise in sales that began last summer.
The number of months of inventory in the Greater Golden Horseshoe region (2.1 months) was up sharply from the all-time low reached in March 2017 (0.9 months). Even so, the December reading stood a full month below the regions’ long-term average (3.1 months) and reached a seven-month low.
Price Pressures Eased
The Aggregate Composite MLS® Home Price Index (HPI) rose by 9.1% year-over-year (y-o-y) in December 2017 marking a further deceleration in y-o-y gains that began in the spring of last year and the smallest increase since February 2016. The slowdown in price gains mainly reflects softening price trends in the Greater Golden Horseshoe housing markets tracked by the index, particularly for single-family homes. On an aggregate basis, only single-family price increases slowed on a y-o-y basis. By comparison, y-o-y price gains picked up for townhouse/row and apartment units.
Apartment units again posted the most substantial y-o-y price gains in December (+20.5%), followed by townhouse/row units (+13%), one-storey single family homes (+5.5%), and two-storey single family homes (+4.5%).
DR. SHERRY COOPER
Chief Economist, Dominion Lending Centres
Sherry is an award-winning authority on finance and economics with over 30 years of bringing economic insights and clarity to Canadians.